In Quebec Canada, are French Canadian Citizens seeking Revenge for recent past Killings in France?
Message boards :
Politics :
In Quebec Canada, are French Canadian Citizens seeking Revenge for recent past Killings in France?
Message board moderation
Previous · 1 . . . 3 · 4 · 5 · 6
| Author | Message |
|---|---|
 Ex: "Socialist" Ex: "Socialist" Send message Joined: 12 Mar 12 Posts: 3433 Credit: 2,616,158 RAC: 2 
|
my extreme world view.... heh.... from bls.gov: "02/03/2017 Payroll employment rises by 227,000 in January; unemployment rate changes little (4.8%)" #resist ID: 1847317 · |
|
KWSN - MajorKong Send message Joined: 5 Jan 00 Posts: 2892 Credit: 1,499,890 RAC: 0
|
my extreme world view.... heh.... Oh, they ARE lying to us... even on the 'unemployment' rates. Their chosen rate that they report in press releases (the U3) is WAY too low. The U6 rate is a much better approximation of the status of the economy. The Bureau of Labor Statistics also calculates six alternate measures of unemployment, U1 through U6, that measure different aspects of unemployment: Now to the page you linked. The most recent year listed in that table 2015 (Jan. 2015 to be a little more exact) (the 2016 data isn't due out on that table for a few days yet) gives the following: Civilian Non-institutional Population: 250,801,000 Total civilian labor force: 157,130,000. Total employed civilian labor force: 148,834,000. Total unemployed civilian labor force: 8,296,000. Not in the civilian labor force: 93,671,000. Now then, for some definition of terms... Civilian Non-institutional Population: People 16 years of age and older residing in the 50 States and the District of Columbia who are not inmates of institutions (penal, mental facilities, homes for the aged), and who are not on active duty in the Armed Forces. Civilian labor force: People in the Civilian Non-institutional Population that are either employed or are unemployed and have looked for work in the last four weeks. After not looking for work for four weeks, a person is no longer in the Civilian labor force. These numbers gives the U3 of 5.3% (it is currently a bit lower). But, if one adds in the discouraged workers (not looking because of a belief that there are no jobs out there for them) you get the U4. Add in those that have looked in the last year, but not the last 4 weeks, to the U4, and you get the U5. To the U5, if one adds in the people that are 'underemployed' (not by choice, but for economic reasons) you get the U6. In Jan. 2015, the U6 was 11.3%. Now then, that is not quite the rosy 'virtually full employment' that the U3 says, now is it? Over one person in 10 is either unemployed or underemployed (for economic reasons). Now then, throwing around that 93,671,000 figure... Granted, there are quite a number of them that have no desire to be working for any number of reasons. Also, there are quite a number that would like to be working but don't think they can get a job the way things are now. Remember, even the U6 (and U5) only measure the part of those that haven't looked between 4 weeks and 1 year. After 1 year, they fall off even that list. It is wrong to assume that ALL of them would like a job. It is ALSO wrong to assume that NONE of them would like a job. But even the U6 tells a much more grim story about the state of our economy than the Government's 'official' U3 rate, especially since quite a number of the 'new' jobs created in the past decade or so have been low-wage, part-time positions. https://youtu.be/iY57ErBkFFE #Texit Don't blame me, I voted for Johnson(L) in 2016. Truth is dangerous... especially when it challenges those in power. ID: 1847357 · |
|
Sarge Send message Joined: 25 Aug 99 Posts: 12273 Credit: 8,569,109 RAC: 79
|
It is wrong to assume that ALL of them would like a job. It is ALSO wrong to assume that NONE of them would like a job. Capitalize on this good fortune, one word can bring you round ... changes. ID: 1847359 · |
|
bobby Send message Joined: 22 Mar 02 Posts: 2866 Credit: 17,789,109 RAC: 3
|
my extreme world view.... heh.... https://www.bls.gov/news.release/empsit.t15.htm Jan '16 (seasonally adjusted) U6 number is 9.9% and Jan '17 is 9.4%, or 10.5% and 10.1% (not seasonally adjusted). So U6 is currently either a little below one in ten, or about one in ten, "over" is a bit of a stretch. Not rosy, though somewhat better than the 11.3% figure you're using. Either way it's a > 10% drop in U6 over the past 2 years. I think you'll find it's a bit more complicated than that ... 
ID: 1847363 · |
|
KWSN - MajorKong Send message Joined: 5 Jan 00 Posts: 2892 Credit: 1,499,890 RAC: 0
|
my extreme world view.... heh.... Yes, Bobby, I know that the U6 has declined in the last 2 years. But, as I said, not even the U6 tells the complete story. Remember... If you have not looked for work for over a year, you fall off of even the U6 (actually you fall off of the U5 -- the U6 = U5 + 'underemployed'). And I said over 1 in 10 in reference to the Jan 2015 (which I labeled as such) figures... not the newer figures. I will research the increase in population, the increase in the civilian non-institutional population, the labor force, and the number not in the labor force, to track how things have gone over the last 2 years (and will cite sources). Oh... and I am not a fan of 'seasonally adjusted' figures. To me, that just smacks a bit too much of 'cooking the data'. Seriously, we must be getting close to agreement if the only thing in my post you decided to try and poke a hole in was the relative age of my figures (Jan 2015 -- the one used in the link in the post I replied to). https://youtu.be/iY57ErBkFFE #Texit Don't blame me, I voted for Johnson(L) in 2016. Truth is dangerous... especially when it challenges those in power. ID: 1847405 · |
W-K 666  Send message Joined: 18 May 99 Posts: 19713 Credit: 40,757,560 RAC: 67 
|
Those numbers, "population over 14" presumably includes all the senior citizens that in most cases have retired. Most if which should never be included in the unemployed lists. It just conveys the wrong message, as witnessed by those that keep bringing up this 90+ million figure. From the census figures, https://factfinder.census.gov/faces/tableservices/jsf/pages/productview.xhtml?src=bkmk, there are about 200 million in what I would call the "workforce" age group, 18 - 65. 14 to 17 year olds should be in school and about 50% of 18 to 22 year olds are presumably in university and not all of the are in the work force. All in all I don't think you can justify a even a figure of 40 million unemployed, as we haven't yet factored in the Armed Forces or the prison population. ID: 1847407 · |
|
bobby Send message Joined: 22 Mar 02 Posts: 2866 Credit: 17,789,109 RAC: 3
|
Jan '16 (seasonally adjusted) U6 number is 9.9% and Jan '17 is 9.4%, or 10.5% and 10.1% (not seasonally adjusted). So U6 is currently either a little below one in ten, or about one in ten, "over" is a bit of a stretch. Not rosy, though somewhat better than the 11.3% figure you're using. Either way it's a > 10% drop in U6 over the past 2 years. Was not attempting to poke holes in anything. As it wasn't clear whether 11.3% was seasonally adjusted or not, I mentioned both. Of course 3 data points can show a trend, though a little more data may be helpful, this shows where U6 has been over the last 20 or so years. Unfortunately it uses the seasonally adjusted numbers, even so, it's likely indicative of the overall trend. It shows the last time U6 was as low as it is today was May 2008, and peaked in October 2009. The steep rises in 2001 and 2008/9 book-ending George W. Bush's Presidency, and gradual declines visible in Clinton's and Obama's Presidencies (W managed 4 years of gradual decline from mid 2003 to mid 2007). I think you'll find it's a bit more complicated than that ...
ID: 1847421 · |
|
KWSN - MajorKong Send message Joined: 5 Jan 00 Posts: 2892 Credit: 1,499,890 RAC: 0
|
Those numbers, "population over 14" presumably includes all the senior citizens that in most cases have retired. WK, Perhaps you did not read what I posted. Civilian non-institutional population was (in 2015) about 250,801,000. This does NOT include those in prison, nursing homes, mental institutions, the Armed Forces, or the under 16 crowd. The figure of about (in 2015) 93,671,000 ALREADY does not include these groups. Yes, the figure of 93,671,000 DOES include the 16 and over people, for they are (by age) part of what is considered the work force. And the upper age on what you might consider the work force is 67, not 65. P.L. 98-21, (H.R. 1900) Social Security Amendments of 1983-Signed on April 20, 1983, raised the retirement age for those born after 1938, and for those born after 1959 it is 67. It needs to be raised again, in my opinion. Now then, that figure of 93,761,000 (in 2015) DOES include students 16 and over, and it does include the retired (but not yet in a nursing home). But, a great many of them ARE of 'working age'. Therefore it is NOT incorrect to refer to it, just don't attempt to say that ALL of them want/need to 'get a job', though many of them do. https://youtu.be/iY57ErBkFFE #Texit Don't blame me, I voted for Johnson(L) in 2016. Truth is dangerous... especially when it challenges those in power. ID: 1847424 · |
|
W-K 666 Send message Joined: 18 May 99 Posts: 19713 Credit: 40,757,560 RAC: 67
|
Those numbers, "population over 14" presumably includes all the senior citizens that in most cases have retired. If you look at it realistically and you take the census figure for 18 - 64, 200,012,857 and take away the employed numbers from the BLS number, 159,187,000, then in the "normal" working age group there are 40,825,857 people to account for. These will include the prison, nursing homes, mental institutions, the Armed Forces populations. Therefore my figure of below 40 million is probably more like a true figure. In fact it is probably below 35 million, appox a third of those quoted by you and others. And if you look at this page http://www.taxpolicycenter.org/model-estimates/tax-units-zero-or-negative-income-tax/tax-units-zero-or-negative-income-tax only 29.6 Million Tax units did not pay Federal Tax or pay roll taxes. Yes I know retirement age has increased and should indeed be higher, but for a lot of people including some of my extended family, who have paid off their mortgage and started receiving their works and private pensions at 65 for men (60 for women in UK) including them in the unemployed bracket is not realistic. And they pay tax on those pensions. ID: 1847434 · |
|
KWSN - MajorKong Send message Joined: 5 Jan 00 Posts: 2892 Credit: 1,499,890 RAC: 0
|
The most recent year listed in that table 2015 (Jan. 2015 to be a little more exact) (the 2016 data isn't due out on that table for a few days yet) gives the following: Note: The 2016 data was just added... TODAY. https://www.bls.gov/cps/cpsaat01.htm Last Modified Date: February 8, 2017 Figures are for 2015 (2016). Civilian Non-institutional Population: 250,801,000 (2016 figure: 253,538,000) Total civilian labor force: 157,130,000. (2016 figure: 159,187,000) Total employed civilian labor force: 148,834,000. (2016 figure: 151,436,000) Total unemployed civilian labor force: 8,296,000. (2016 figure: 7,751,000). Not in the civilian labor force: 93,671,000. (2016 figure: 94,351,000). https://youtu.be/iY57ErBkFFE #Texit Don't blame me, I voted for Johnson(L) in 2016. Truth is dangerous... especially when it challenges those in power. ID: 1847447 · |
|
W-K 666 Send message Joined: 18 May 99 Posts: 19713 Credit: 40,757,560 RAC: 67
|
The most recent year listed in that table 2015 (Jan. 2015 to be a little more exact) (the 2016 data isn't due out on that table for a few days yet) gives the following: And as far as I can make out ~46 million (2016) of those not in work are over 65 and have retired. And a Gallup survey says that "baby boomers" are not acting any way different from pre-baby boomers, they still retire at 65 or younger. 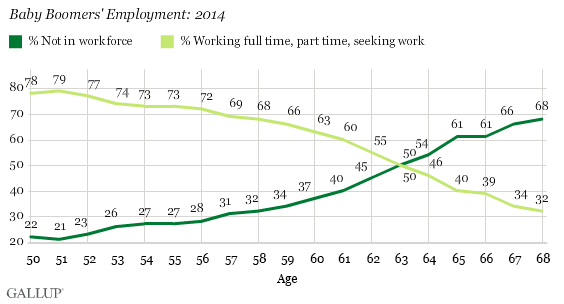 source - Gallup ID: 1847472 · |
|
KWSN - MajorKong Send message Joined: 5 Jan 00 Posts: 2892 Credit: 1,499,890 RAC: 0
|
The most recent year listed in that table 2015 (Jan. 2015 to be a little more exact) (the 2016 data isn't due out on that table for a few days yet) gives the following: So? Just why are you arguing this point? You seem to be trying to discredit the US Federal Government's Bureau of Labor Statistics' figure of (2016 figures) 94,351,000 that are 'not in the civilian labor force' by saying that a good chunk of them 'should not be in the civilian work force' because they are of retirement age... Sorry, it is a bit difficult to follow your logic here. If your figure of 46 million are incorrectly classified as being 'not in the civilian work force' that means that that 46 million ARE in the civilian work force. That would bump the U3 up to 20.55%, which is obviously not the case. Where are you going with this? https://youtu.be/iY57ErBkFFE #Texit Don't blame me, I voted for Johnson(L) in 2016. Truth is dangerous... especially when it challenges those in power. ID: 1847541 · |
|
W-K 666 Send message Joined: 18 May 99 Posts: 19713 Credit: 40,757,560 RAC: 67
|
Because Guy said 93 million are "out of work" and how he worded his comment, I interpreted as unemployed, not as "not in workforce" http://setiathome.berkeley.edu/forum_thread.php?id=80942&postid=1847018#1847018 ID: 1847545 · |
|
KWSN - MajorKong Send message Joined: 5 Jan 00 Posts: 2892 Credit: 1,499,890 RAC: 0
|
Because Guy said 93 million are "out of work" and how he worded his comment, I interpreted as unemployed, not as "not in workforce" Ahh.. I understand it now. However, while many of that about 94,351,000 (using the more current 2016 figures instead of the 2015 figures Guy used) are not 'out of work' but instead are 'not employed by choice (stay at home parents,etc.)', a number of that 94+ million would like to work, but are very discouraged at their chances of finding a job. As I said: KWSN-Majorkong wrote: It is wrong to assume that ALL of them would like a job. It is ALSO wrong to assume that NONE of them would like a job. http://setiathome.berkeley.edu/forum_thread.php?id=80942&postid=1847357 Without a doubt, some of the 94+ million would like to work, but have given up looking. What proportion would? I dunno. For those that have not looked for a job for more than 4 weeks but less than 1 year, see the U4/U5. For those that haven't looked in over a year, your guess is as good as mine on that one. https://www.bls.gov/cps/cpsaat01.htm Remember, the U3 is the unemployed that have looked for work in the last 4 weeks. The U4 is, roughly the U3 + the 'discouraged workers' (a subset of 'marginally attached workers') that have looked for work in the last year, but not the last 4 weeks. The U5 is roughly the U3 + ALL 'marginally attached workers' that have looked for work in the last year, but not the last 4 weeks. The U6 is, roughly, the U5 + the 'underemployed for economic reasons (wants a full time job, but can only find a part-time job)'. After 4 weeks of not looking for a job, a person falls off of the U3 and into the 'not in the labor force' category, but might remain on the U4/U5. After one year of not looking for a job, a person falls off of the U4/U5. https://www.bls.gov/webapps/legacy/cpsatab15.htm But note the following note on that page: NOTE: Persons marginally attached to the labor force are those who currently are neither working nor looking for work but indicate that they want and are available for a job and have looked for work sometime in the past 12 months. Discouraged workers, a subset of the marginally attached, have given a job-market related reason for not currently looking for work. Persons employed part time for economic reasons are those who want and are available for full-time work but have had to settle for a part-time schedule. Otherwise, you can select data on that page for display to your hearts content. But, back to the figures. The US Government says that there are about 94 million not in the civilian labor force, but otherwise eligible. Take your figure of 46 million 'retirees' out of the 94 million, and you are still left with 48 MILLION people. https://youtu.be/iY57ErBkFFE #Texit Don't blame me, I voted for Johnson(L) in 2016. Truth is dangerous... especially when it challenges those in power. ID: 1847574 · |

©2025 University of California
SETI@home and Astropulse are funded by grants from the National Science Foundation, NASA, and donations from SETI@home volunteers. AstroPulse is funded in part by the NSF through grant AST-0307956.