Back to Eric's Home Page
SETHI@Berkeley-- A Piggyback 21-cm Sky Survey at Arecibo
SETHI@Berkeley- A Piggyback 21-cm Sky Survey at Arecibo
A poster presented at the ``Seeing through the Dust''
conference at the Dominion Radio Astrophysical Observatory, October 2001
Click here for a PDF version of this poster
Eric Korpela, Paul Demorest, Eric Heien, Carl Heiles, Dan Werthimer
University of California, Berkeley
Abstract
SETI@home observes a 2.5 MHz bandwidth centered on 1420 MHz near the
21-cm line using a short line feed at Arecibo which provides a 6˘
beam. This feed sits on Carriage House 1, which means that during normal
astronomical observations with the new Gregorian dome the feed scans across
the sky at twice the sidereal rate. We are using the SETI@home receiver to
obtain about 4.4×10⁶ spectra per year with integration time of 5
seconds per spectrum. We have accumulated 2.6 years of data covering
most of the sky observable from Arecibo. This survey has much better
resolution than previous single dish surveys and much better sensitivity than
existing or planned interferometric surveys.
Observing Methodology
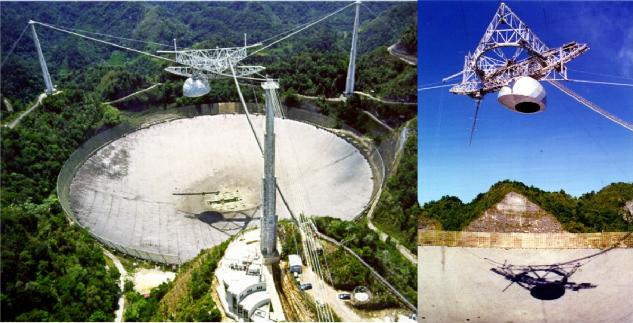
The UCB SETI searches use the 1420 MHz line feed on Carriage House 1 at the
National Astronomy and Ionospheric Center's 305 meter radio telescope in
Arecibo, Puerto Rico. (See Figure 1) This unique arrangement allows
observations to be conducted without interference with other uses
of the telescope. This results in two main modes of observation. If the
primary observers feed is stationary or stowed the beam scans across the
sky at the sidereal rate. If the primary observer's feed is tracking a position
on the sky, the beam scans the sky at twice the sidereal rate. At twice
the sidereal rate, the beam width corresponds to a 12 second beam transit time. [Korpela et al. 2001] Figures 2 and 3 show the path of the telescope beam over the course of 1 day, and the entire program respectively.
Figure 1: A photo of the NAIC 305 meter telescope at Arecibo. The inset at
right shows the details of the ``carriage house'' structure. The feed used by
this project is the line feed extending downward from the carriage house.
(Photos courtesy of NAIC-Arecibo Observatory, a facility of the NSF.)
Figure 2: The path of the telescope beam on August 5, 2001.
Figure 3: Sky coverage for entire project.
The time domain data for the sky survey is recorded as follows: first,
a 30 MHz band from the receiver is converted to baseband using a pair
of mixers and low pass filters. The resulting complex signal is digitized and
then filtered to 2.5MHz using a pair of 192 tap FIR filters in the SERENDIP IV instrument.
[Werthimer et al. 1997]
One bit samples are recorded on 35 GByte DLT tapes (one bit real and one bit imaginary per
complex sample).
These tapes are shipped to Berkeley for use in the SETI@home program.
Tsys for the system is 75K.
The SETHI@Berkeley program analyzes these tapes to extract hydrogen spectra.
The 2.5 MHz time series data are converted to raw spectra using 2048 point
FFTs (Dn=1220 Hz). 6144 FFTs are accumulated into a single
power spectrum of 5.033 second
integration time. The resulting power spectrum is corrected for 1 bit sampling
effects by using the Van Vleck correction. The spectrum, its start and
and end coordinates, and its time are stored in a database for future use.
This database will be queried to develop spectral maps of the neutral hydrogen
distribution.
Example Spectra
Below we present an individual spectrum. This
spectrum was taken along a line of sight near 3C192 (l,b)=(197.7,24.4).
The hydrogen column along this line of sight is ~ 4.2×10²⁰
cm-2
Figure 4 shows a single raw 5 second integration spectrum with
1.22 kHz resolution.
Figure 5 represents the sum of 5 adjacent spectra, and shows
the typical
SNR that will be achieved in a 0.1 degree skymap pixel.
Figure 4: A 5 second integration spectrum
Figure 5: A 25 second integration along the same line of sight.
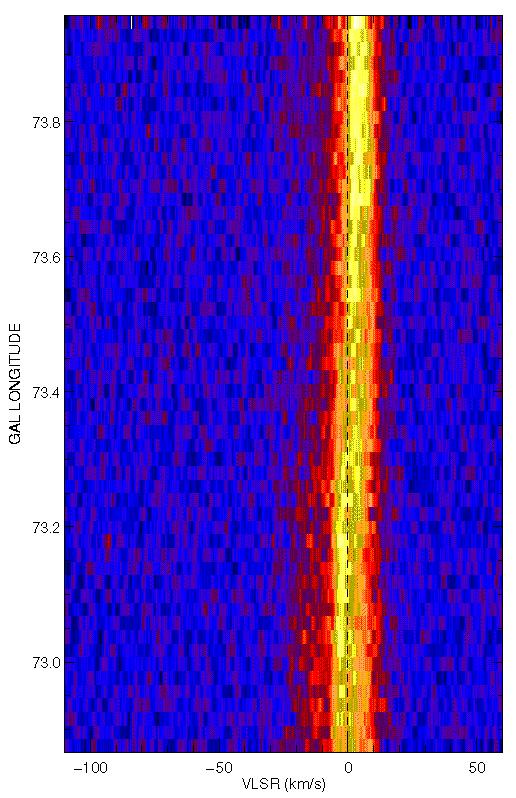
Figure 6 shows 54 spectra accumulated over 272 seconds. During the accumulation
of these spectra the telescope beam was moving at nearly the sidereal rate
( ~ 1.1 degrees over this duration). Significant changes are seen
in the spectra are seen on scales approximating the beam width.
Figure 6: Spectra generated from 272 seconds of data. This sweep extends from
(l,b)=(72.87,-22.99) to (l,b)=(73.96,-23.52). Each spectrum represents
5 seconds of data and transit of about 1/5 the beam width. Note the significant
changes in line shape and velocity on scales ~ the beam width.
Program Status
Data accumulation for SETI@home began in December 1998. We currently have
accumulated about 58 Msec of observation time, which will translate into
11.5 million spectra.
The survey has covered 79.4% of the accessible sky. If mapped
into pixels 1 beam width in size, the median exposure per pixel is ~ 20
seconds. We anticipate that data collection will continue for at least
1 additional year.
Generation of the spectral database is just beginning. We anticipate analysis
of the existing data to be complete in 12 months.
References
- [Korpela et al. 2001]
- Korpela et al. 2001 Computing in
Science and Engineering, 3, 79.
- [Werthimer et al. 1997]
- Werthimer et al. 1997, in
Astronomical and Biochemical Origins and the Search for Life in the Universe, eds: Cosmovici, Bowyer, & Werthimer, (Editrice Compositori:
Bologna), 711.

FastCounter by bCentral
Back to Eric's Home Page
Copyright © 2001 Eric Korpela
korpela@ssl.berkeley.edu
File translated from
TEX
by
TTH,
version 2.87.
On 6 Nov 2001, 10:53.